Vibration Diagnostics with Raw Acceleration Data Sensors
Content of This Article
Vibration Diagnostics with Raw Acceleration Data Sensors
In modern industrial plants, continuous condition monitoring of machines and systems is essential for smooth process flows. Whether motors, pumps, roller bearings, or wind turbines and crane systems—every machine generates a certain level of vibration during operation. These are recognized and analyzed by vibration sensors. Changes due to misalignment or wear can be detected at an early stage, allowing preventive maintenance measures to be initiated before damage or costly downtime occurs.
In vibration diagnostics, there are two different methods for monitoring the performance and condition of machines: unbalance measurement and frequency analysis. Acceleration measurement is the underlying measurement technique for both.
Frequency Analysis Based on Raw Acceleration Data and Fast Fourier Transform
While unbalance measurement based on Root Mean Square (RMS) sensors primarily aims at general machine monitoring, frequency analysis based on raw acceleration data enables a more in-depth analysis of vibration behavior.
To capture frequency as a characteristic, a specific measurement method is required in addition to the raw acceleration data. This method is called Fast Fourier Transform (FFT). FFT makes it possible to break down a signal into its frequency components and analyze them efficiently.

The frequency indicates how often an oscillation (deflection from the zero point) occurs within a certain period of time and is measured in Hertz (Hz). 1 Hz corresponds to one oscillation per second. The sampling rate also plays a crucial role in frequency analysis, as it determines how often a signal is sampled per unit of time. The higher the frequency of a raw acceleration, the higher the required internal sampling rate.
A sampling rate that is too low can lead to a phenomenon known as the alias effect. This occurs when higher frequencies in the signal are misinterpreted as lower frequencies, which can lead to distortion and incorrect analysis. The following example illustrates the alias effect:

The light green curve represents the actual raw acceleration signal. The dark green curve is created when each point is a measurement point or a sampling point. Comparing both curves readily reveals that the original signal is not accurately reconstructed due to the slow sampling rate. Applying an FFT to the dark green measured raw acceleration signal would result in a frequency much lower than the actual frequency. In the context of vibration diagnostics, this means that important details necessary for analyzing and interpreting data may be lost.
Improved Safety Through Higher Sampling Rate: A Closer Look at the VIM3 12 kHz Vibration Sensor
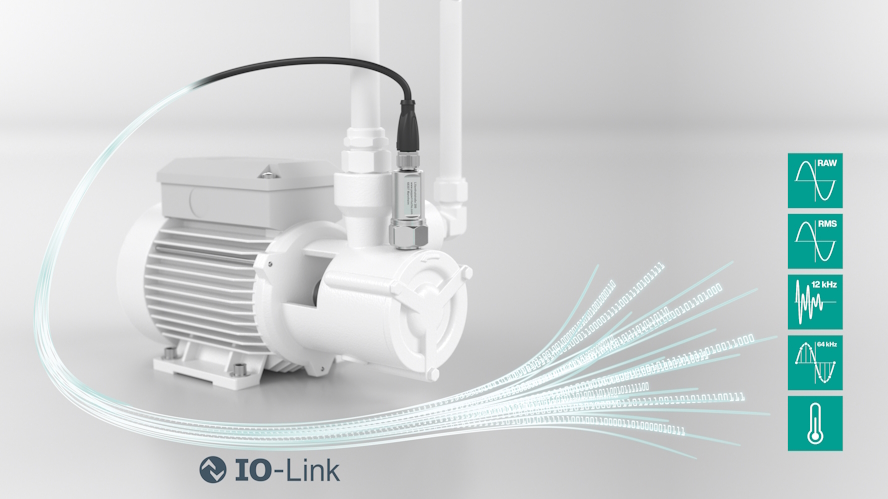
With the VIM3 12 kHz, Pepperl+Fuchs has developed a vibration sensor with a particularly high sampling rate of 64 kHz. This means that the sensor can capture raw acceleration data of up to 12,000 vibrations per second and measure at a sampling rate that is five times faster than the initial vibration. This results in 64,000 measurement points per second. Compared to its competitors, the VIM3 12 kHz sensor offers significantly higher data accuracy, which can be used as the basis for a reliable FFT.
Since the usual cyclical IO-Link channel would be too slow to transmit these large amounts of data, the VIM3 vibration sensor uses IO-Link BLOB (Binary Large Object) transfer. In this process, the sensor measures the raw data and stores it in an internal memory. The data can then be retrieved via the IO-Link connection and transmitted in “packets”. New raw data can only be recorded once the internal memory has been completely read out. This step-by-step transmission prevents the entire amount of data from being loaded into the Random Access Memory (RAM) at once, which could otherwise cause performance issues, especially when handling very large datasets.

Subscribe to our newsletter and receive regular news and interesting facts from the world of automation.